A week ago, we noticed that OIH, the ETF that tracks oil stocks, was showing signs of a potential move. (check out the article here)
Sometimes, the charts can see things we don’t even know are happening behind the scenes. There could be a plausible explanation. Someone has insider info, big money has access to legit info that we haven’t seen yet, or the media just hasn’t decided it was a story worth flooding our screens with. Whatever the reason, the chart can reveal moves before we get the explanation behind the move.
When we looked at oil last week it was because it seemed like slightly lower gas prices had lulled traders into a sense of complacency. That inspired a dive into the chart. This is really about using human nature to narrow down what stocks and charts you dive into .
The announcement now that OPEC will reduce production makes the set up we looked at even more appealing.
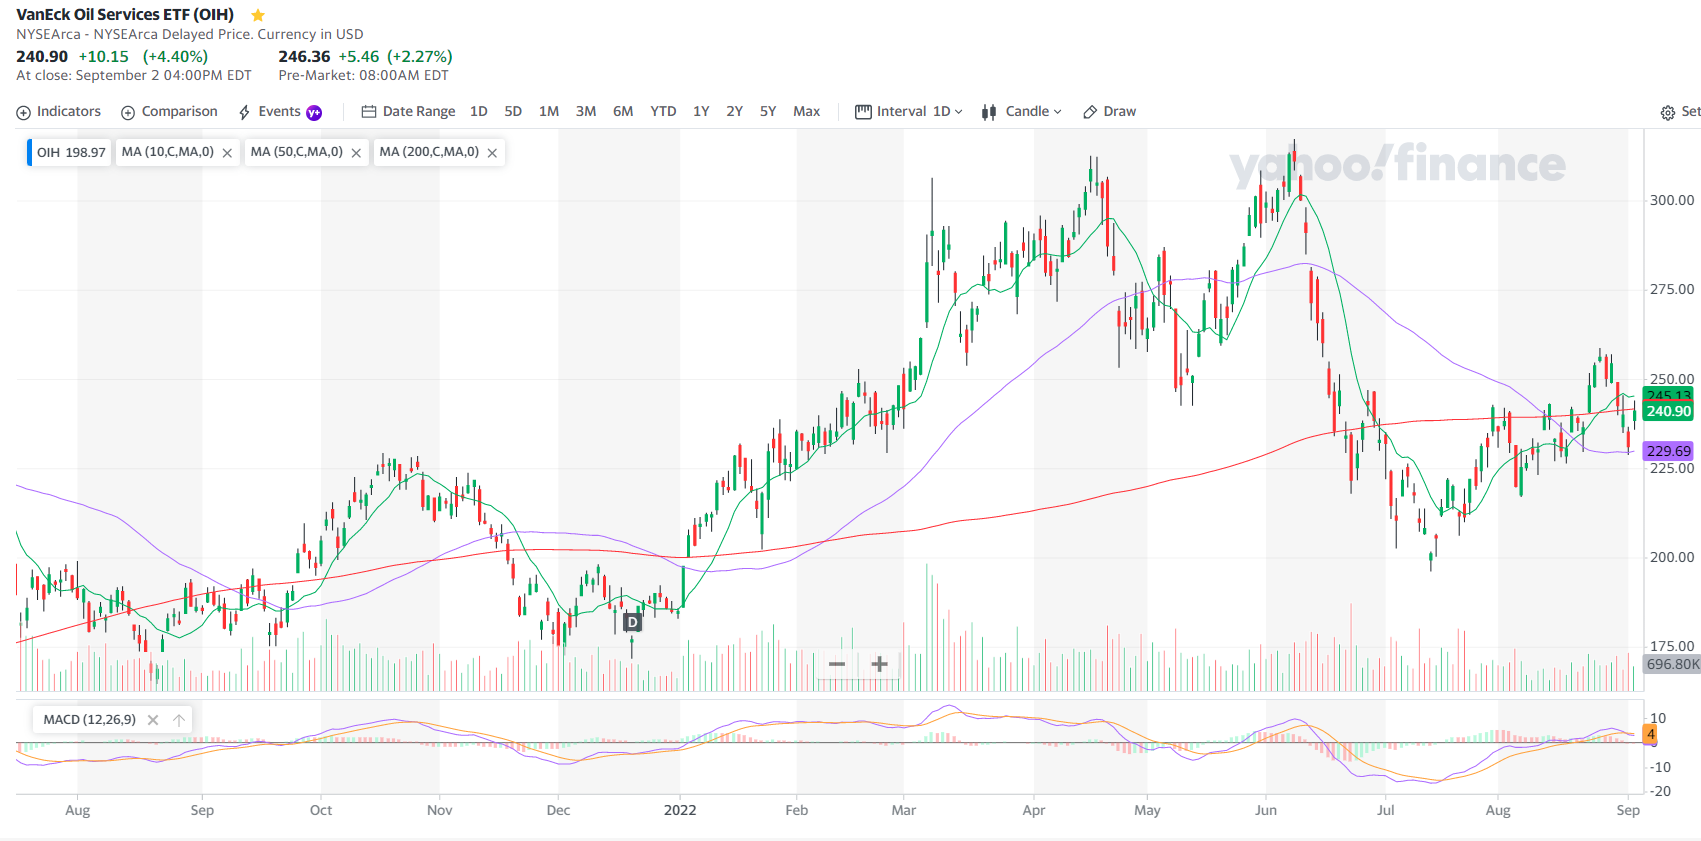
We saw an initial sign of support at the 50 day moving average (shown in purple on the chart). A run back above 250 might be all we need for that Oct 305 Call to pop.
Herd mentality is a driver in the markets that can be easier to spot and exploit than you might think. We are a predictable group, us humans, and we tend to act in consistent patterns. Combine that with the charts that can reveal how those behaviors affect price movement in repeatable ways and you start to see great potential set ups more frequently.
Ian Cooper does a great job of showing how that herd mentality can be exploited in his Trigger Point Trade Alerts. Check it out here.
Keep learning and trade wisely,
John Boyer
Editor
Market Wealth Daily


Recent Comments