
Friday, July 23rd, 2021
Happy Fabulous Friday!
I teach everyday people (like me) to trade options. I do my best to write in an understandable way as if we are talking over the kitchen table.
The Dow has been up two days and down one as I type on Wednesday. Monday’s drop was a doozy. Tuesday it recovered a large portion of that pullback and Wednesday morning was up but flat as digested the last two days.
For today’s Trade of the Day, we will be studying Virgin Galactic Holdings, Inc., symbol (SPCE). Searching for symbols today has been a challenge. Even though equities have been recovering the last two days, their patterns and indicators turned bearish in the big drop on Monday and have not yet had a chance to change. And, since they have risen the last two days even though their indicators look bearish, price is rising so it doesn’t make sense to consider a Put trade. We are in a transition stage. SPCE held and maintained its bullish indicator despite the drop and 3 days into the week has had a healthy 9% rise.
Virgin Galactic Holdings, Inc., an integrated aerospace company, develops human spaceflight for private individuals and researchers in the United States. It also manufactures air and space vehicles. The company’s spaceship operations include commercial human spaceflight, flying commercial research, and development payloads into space. In addition, it engages in the design and development, manufacturing, ground and flight testing, and post-flight maintenance of spaceflight vehicles.
The company was founded in 2017 is headquartered in Las Cruces, New Mexico.
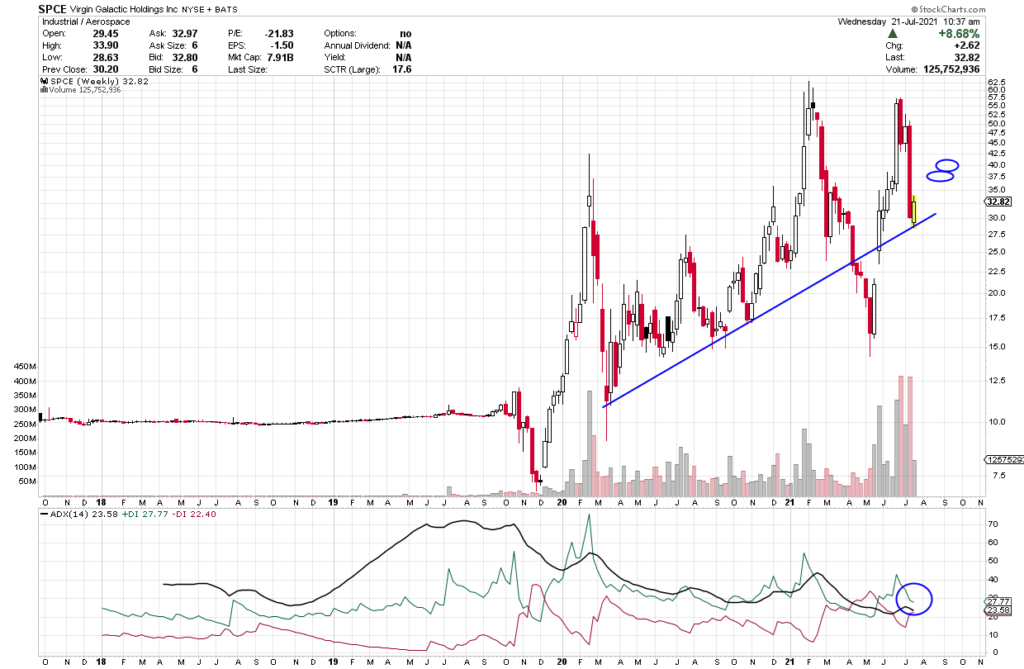
SPCE has risen this week and looks ready to head higher after a large drop last week
Let’s take a look at SPCE’s weekly chart.
The ADX +DI (green line) is above the -DI and the ADX line should turn up. As long as the +DI is above the -DI, price should rise. Green above red is an indication of strength. When the +DI is bullish and then the ADX turn up, it shows strength. If you want to learn more about ADX, read on or, if not, scroll down to the alert.

Average Direction Index (ADX) – Strength Indicator
The Average Directional Index consists of 3 lines: Green, Red and Black.
Green = +DI (Bullish)
Red = -DI (Bearish)
Black = ADX Strength Line
The DI line that is on top is in control. If the ADX line is heading up, strength is supporting the DI line that is on top and in control.
Check Out the Trade Alert Signal
Each candle on the chart represents price movement over a 5-day (week) period; therefore, it takes weeks for trades to play out. On the chart, the week has risen in a nice string of upward moves. When the +DI crosses over the -DI line, it gives a buy signal [as the +DI line (green) appears as if it is in control and ready to head up on the ADX indicator], and if the ADX turns up that is even more bullish, suggesting an upward move is gaining strength. I’d like to see the green line to turn up to continue its upward bias and then the black line to turn up as well. When it also turns up will be great- all are bullish signs of strength. When the +DI crosses the ADX (black line) and when it rises, it shows a new burst of strength coming into the equity.
The Black ADX line is a strength line and if it flips up and continues to head up, it shows strength, and, once it happens, we will know strength will continue to flow into this equity. We will keep an eye on SPCE over the course of the next few weeks.
The short-term price target for SPCE is $37.50 and then, perhaps, $40 and higher.
SPCE Potential Trade – Showing Strength
This signal could give a quick payout if it continues its upward move, and the strength of this pattern continues. It looks as if it could push above $37.50.
To buy shares of SPCE today would cost approximately $33 per share and if it reaches its near-term target of $37.50 that would be a gain of $4.50.
This is a great example of the benefits of trading options. Let’s discuss this as a study case.
Option trading offers the potential of a lower initial investment and higher percentage gain. Let’s take a look and make a comparison.
The plus DI (green line) is above the -DI and if it stays above the -DI (red) line by Friday a call trade can be considered.
If you buy 10 shares of SPCE at $33, you will invest $330. If the stock increases in price to $37.50, you will earn a profit of $4.50 per share or $45 for the 10 shares or about 13%.
If you bought one option contract covering 100 shares of SPCE with a Aug 20th expiration date for the $37.50 strike and premium would be approximately $2.49 today or $249 per 100 share contract. If price increased to the expected $37.50 target or a gain of $4.50 over the next few weeks, the premium would likely increase $3 to $5.49 (3 x 100 share contract = $300 Profit. $3 profit on your $249 investment, this is an 120% gain. Nice! Terrific trade if it hits it target!
Trading options is a win, win, win opportunity. Options often offer a smaller overall investment, covering more shares of stock and potential for greater profits.
I like to stress when trading options, you don’t need to wait for the expiration date to close the trade. You can close anywhere along the way prior to the expiration date. It is never a bad idea to take profit.
Trading options is like renting stocks for a fixed period of time. The potential to generate steady income with options is real and it can be transforming. Watch this video to learn how you can use option trading to achieve financial freedom. click here
Yours For a Prosperous Future,
Wendy Kirkland
PS-I have created this daily letter to help you see the great potential you can realize by trading options. Being able to recognize these set ups are a key first step in generating wealth with options. Once you are in a trade, there is a huge range of tools that can be used to manage the many possibilities that can present themselves. If you are interested in learning how to apply these tools and increase the potential of each trade, click here to learn more.

Past Equity Candidates:
Four weeks ago, we looked at ETSY’s July 23 expiration on 190 strike, paying 5.80 premium. Its premium went as high as 6.75 but then pulled back. Its premium is now 4.70.
Three weeks ago, we zeroed in on NIO. It has moved down instead of up and has lost value. It had a 65 strike with a July 23rd expiration with a .96 premium. It has been down 3 weeks in a row.
Two weeks ago, we examined LULU with an August 6th expiration and 390 strike and a premium of 5.35. Premium went as high as 7.50 and is now at 4.45 with the market pullback.
Last week, we studied TWTR with a 75 strike, Aug 20 expiration and a premium of 3.35. It headed down with the pullback and its premium is now 2.38.


Recent Comments