
Here is the process I use to look for a trade. It has worked well for the most part and that is really what we are going for in trading. More winners than losers and keep the losers smaller than the winners.
If you follow this column, you know I like the MACD Crossover. When I am scanning for a new trade, I run the MACD Bullish Crossover scan in Stockcharts.com and see what pops up. Then I look for stocks with a bullish crossover that also have high volume. That usually narrows it down quite a bit.
I then look at stocks I have some familiarity with. This helps in that you can immediately know what the stock has been doing lately. It isn’t critical, but it helps. When I did this today, a clear candidate was AT&T (T).
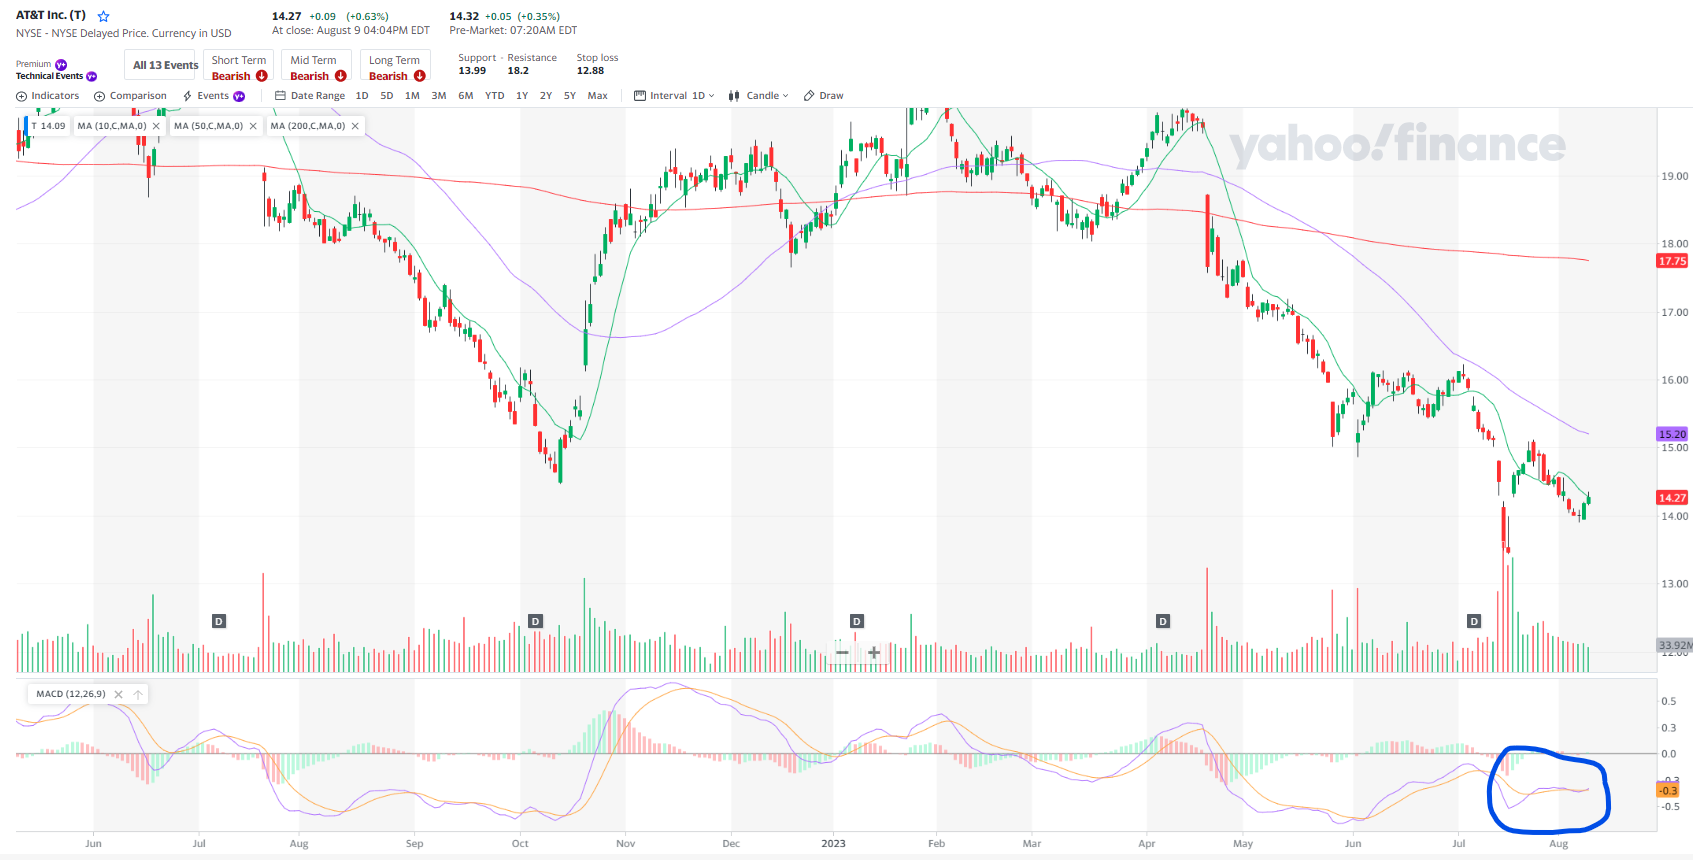

I highlighted in a blue circle where the scan I run is picking up the MACD crossover. It’s there, but it isn’t as clear as we would like. So then I look at the moving averages and you can see that it really hasn’t broken the downtrend yet. We would really want confirmation of a reversal in a move above the 10 day moving average as an initial confirmation. Also, we can see that the MACD for AT&T is a little all over the place.
In this case, I will keep a closer eye on it but it isn’t a solid buy candidate yet.
Sometimes, you have to plant seeds that may grow later. This is a seed in the field we will watch to see if it sprouts.
Keep learning and trade wisely,
John Boyer
Editor
Market Wealth Daily


Recent Comments