
by Oliver Velez
I have often said that no one knows with any certainty the long-term direction or duration of the stock market. The longer the time frame, the less certainty there is. Even on a day-to-day basis, there is no certainty. We often look to certain patterns to reproduce themselves, but news events, earnings, company announcements, upgrades, and downgrades always make anticipation of market moves a risky business. If you think the stock market will always go up, look at the last few years. Years of profits can be taken away in 18 months. What if it takes 40 years to return to those levels? At that time, they can once again say that the trend is always up, but will that be meaningful to you? Look at Japan over the last 20 years. Nothing can be taken for granted.
So why do we study pattern? What can we gain if all the study in world still falls short of any kind of certainty? There are very valid reasons to keep an eye on the direction of the market and individual stocks.

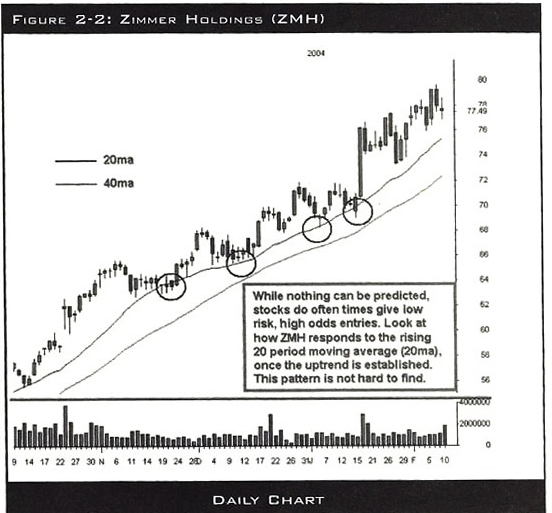
First of all, while even the short term (three to five day) outlook cannot be predicted, certain patterns do give us the low risk entries to strategies we use. Take for example a market or stock that has been in an uptrend (we can always define and find the trend by looking at charts and the history of prior price action) and pulls back for a few days to an area of support. Then on that day, it gets the strength to close over its open price. Whether you play the market or a particular stock that shows the same pattern (and many will), this often draws a line in the sand where we can play strategies, knowing that the current day’s low is the support upon which we are relying. That will be the stop for the play. The target usually will be far larger than the stop, as it looks to challenge or exceed prior highs when in a trend. Patterns often do repeat, like on the chart in figure 2-2, a daily chart for Zimmer Holdings.
Often, traders overreact to the moves a stock may have on a smaller time frame and forget that patience is necessary to play the bigger time frame. When playing the daily chart, it is often the case that a stock makes a beautiful move, but the trader had sold the stock long ago. Why? The trader sold because he forgot that he was playing the daily chart, and overreacted to intraday moves. He was shaken out even though the proper time frame showed no reason to sell. If you want the bigger moves on the daily chart, you may have to live through some pullbacks intraday.
Second, it can be important to know exactly what stage the market is in, as shown in the daily chart for CIT Group (Figure 2-3). You’ll find that different strategies have varying degrees of success depending on where the market is in a bigger time frame. For example, in a strong uptrending market, you will find that basing patterns frequently are broken to the upside forming a stair step pattern. This is a strong pattern in a strong market. However, the same trader who continues to use this pattern without recognizing that the market has now lost momentum and is in a basing phase will not have the same success. Traders will find that breakouts do not carry as far or they start to fail and become losses.

Let me provide a real life example. At a recent mentorship, a student arrived who had been very successful over the prior six months, but was having great trouble the last few weeks. He was a good student who had a good trading plan and liked to play basing stocks. He had a great feeling of success after playing base stocks in a market that was moving strongly in one direction. He became a little complacent and did not continue to track his results and strategies. He did not notice that his favorite play was no longer providing profits. When asked, he felt that his basic strategy was still his most successful, even over the prior few weeks. Looking deeper, it was revealed that this was not an accurate statement based on his trading record. He felt it to be true, because he remembered only the success of that strategy. Many of us do.
How could the trader have avoided this? He needs to understand his strategy and know when it is best suited for the current market. Second, he should keep an eye on major trends in the market and any change in trend to reevaluate the strategies that he is currently using to avoid the problem. Also, if he continues to track his results and strategies, he’ll notice the change in success rates of the different strategies he uses as the market changes. I don’t mean just long or short. I mean which particular strategy to be used when you are long and how aggressive to be with the targets. Is it appropriate to go for new highs or 40 percent retracements? Is it best not to trade that time frame at all based on the strategies in your trading plan?
So how does a new trader begin to understand the basics of the current market trend? Let me give you a few guidelines that hold true at any experience level. Moving averages are always a good guide for establishing the current trend. Are the 20ma and 40ma rising or falling? Is the price above or below the 200ma? Is the 20ma above the 40ma? Are we in a pattern of higher highs and higher lows or are they starting to even off, showing the potential for a base to form? Are the Wide Range Bars (WRBs) green or red, and do they hold their moves or are they reversed?
Many traders like to be market gurus and make bold predictions regarding the market. I think it is a wiser choice to follow a plan, play proven strategies, and always keep a close eye on what the market has done to help you determine your best course of action in the future. Have separate accounts for wealth building (swing and core positions) and for income producing (day trading and guerrilla positions) so you can cash in on the bigger moves.


Recent Comments