
| Thursday, June 3rd, 2021 |
| S&P is Making Up Its Mind |
Happy Thriving Thursday!
This week started with a burst out of the gate after a long holiday weekend. It shot up and remained there for about 15 minutes and then, started to slowly drop to close the day flat and about where it was on Friday. It is as if it is trying to make up its mind what happens next. Daily and intraday swings make it hard to trade short-term. This is one of the reasons that weekly time frame charts work out so well. We are zeroing in on long term patterns, not daily swings.
Am going to call Thursday “SPY Day”. Each Thursday, I will focus on what SPY is doing, with the hope it will help give us a clue about the market as a whole.
SPY or the SPDR S&P 500 trust is an exchange-traded fund which trades on the NYSE Arca under the symbol SPY. SPDR is an acronym for the Standard & Poor’s Depositary Receipts, the former name of the ETF. It is designed to track the S&P 500 stock market index. This fund is the largest ETF in the world and gives a good overall picture of the market. SPY includes shares from the top 500 companies.
The image below is a simple chart image of price movement on Tuesday where you can see the morning rise and then the slow drift south to end the day near the red dotted line which is where it closed on Friday. Up and down, it wove.
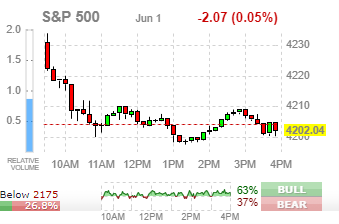

This chart image is courtesy of FINVIZ.com a free website and gives a quick view of each day’s movement.
True Strength Indicator
The True Strength Index (TSI) is an oscillator that fluctuates between positive and negative territory. As with many momentum oscillators, the centerline defines the overall bias. The bulls have the momentum edge when TSI is positive and the bears have the edge when it’s negative. As with MACD, a signal line can be applied to identify upturns and downturns. Signal line crossovers are, however, quite frequent and require further filtering with other techniques. Chartists can also look for bullish and bearish divergences to anticipate trend reversals; however, keep in mind that divergences can be misleading in a strong trend.
TSI is somewhat unique because it tracks the underlying price quite well. In other words, the oscillator can capture a sustained move in one direction or the other. The peaks and troughs in the oscillator often match the peaks and troughs in price. In this regard, chartists can draw trend lines and mark support/resistance levels using TSI. Line breaks as well as line crosses can then be used to generate signals.
Plain and Simple
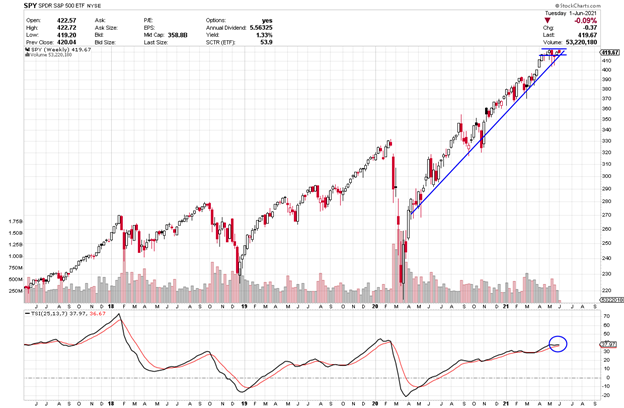
On the line indicator at the bottom of the chart, look how the black line dipped down and now appears as if it may bounce up from there or it may cross down if it weakens further.
It is deciding what it should do from here. For the most part, it has been stuck at this level between a ceiling and floor (resistance and support) since mid-April.
TSI Buy Signal
Each candle on the chart represents price movement over one day. SPY is suggesting confusion. The TSI line is flat and as long as it continues to remain flat, price is apt to go up and down making little headway
It needs to either break through the ceiling to then rise further in price or it needs to break through the floor and price will then drop and perhaps, take the market into a correction.
Periodically, there are times where the smartest thing you can do is sit back and watch how things play out.
Below I will discuss how things could be traded, depending on the direction SPY decides upon.
Check out the profit potential of option trading versus buying stock. Big difference!!!
Excited About SPY- Options Trade Both Directions (Depending on what happens)
To buy shares of SPY today would cost approximately $420 per share (as I write this on Tuesday morning).
Option trading offers the potential of a lower initial investment and higher percentage gain. Let’s take a look and compare.
If you bought 2 shares of SPY at $420, you would invest a total of $840. Now if SPY were to break above the ceiling line at $423 and say, move as high as $430, it would profit $7 per share or $14 for the two shares. Not an exciting profit.
If it drops through the floor at $415, you lose $8 per share or $16 for the two shares if it stopped at that level or even more if it kept dropping.
Now to compare. If you bought one Call option contract covering 100 shares of stock with a July 16th expiration date for the $430 strike (if price rose above the ceiling), the premium would be approximately $3.75 per share or $375 for the contract. If price increased the expected $7 over the next few weeks, the option premium would increase approximately $7 to $10.75. This is a gain of $700 or 186%.
Now if SPY drops through the floor at $415 line and say dropped to $410 or another $5 down, you could purchase of Put Option for the $410 strike when drops through the line $415. The ask premium for the 410 strike put would be approx. $7 per share or $700. If it continued to drop to $410, the option would gain $5 in profit, increasing its premium to $12 per share. This is a profit of $500 for an option on an equity that is losing value.
These types of trades, in either direction, are what can bring life-changing financial gains.
I want to stress, when you trade options, you can close the trade anywhere along the line to take profit (or loss). You don’t have to wait until it hits the target or until expiration day.
You also want to wait for the indicator confirmation and don’t jump-the-gun with an early entry.
Trading options can be a win, win, win opportunity. Options often offer a smaller overall investment, covering more shares of stock and potential for greater profits.
What’s Next? I Can Hardly Wait!
Keep an eye on your inbox and I will keep sharing what I have my eye on. If you want to get deeper into how I find these winners, be sure to check out the programs in the banners in this message to learn more about options.
I love teaching and write my strategy books as clear as I write these emails. I try to think of the questions you’ll ask before you ask them. Sign up and join me in the profit potential.

PS-I have created this daily letter to help you see the great potential you can realize by trading options. Being able to recognize these set ups are a key first step in generating wealth with options. Once you are in a trade, there is a huge range of tools that can be used to manage the many possibilities that can present themselves. If you are interested in learning how to apply these tools and increase the potential of each trade, click here to learn more.

Past Thursday’s Symbols:
Seven weeks ago, we studied Walmart (WMT). It has been down a little the last three weeks with a target of 145 and has until June 18th. This week it is was down .37. It went up to a high of 144.84 a couple weeks ago.
Six weeks ago, we looked at Starbuck’s (SBUX). It has a 120 target and down a little this week on Tuesday as I prepare this. It has been down slightly the last 4 weeks. It is at 113.34. It has until June 18th when it will expire.
Five weeks ago, we examined American Airlines (AAL)with the thought that its price would drop. It had a 16 strike Put option. It dropped to 19.64 three weeks ago and this week is up as high as 24.67. This doesn’t look as if it will drop further.


Recent Comments