
Wednesday, September 1st, 2021
Happy Wonderful Wednesday!
Last week, the market gave us three bearish days out of five. This week opened up. Many equities last week had a substantial pullback and are now starting to recover. The three main indices headed down and started to recover on Thursday and Friday. Monday this week started with a nice rise in the indices.
To review past equity candidates, scroll down.
For today’s Trade of the Day, we will be looking at Rite Aid Corporation, symbol (RAD). Before analyzing RAD’s chart, let’s take a closer look at the stock and its services.
Rite Aid Corporation, through its subsidiaries, operates a chain of retail drugstores in the United States. The Retail Pharmacy segment sells prescription drugs and an assortment of other merchandise, including over-the-counter medications, health and beauty aids, personal care items, cosmetics, household items, food and beverages, greeting cards, seasonal merchandise, pet care, and other every day and convenience products, as well as brand and generic prescription drugs. It also operates retail clinics that provide treatment for common conditions; and provides preventative services. In addition, this segment offers healthcare coaching and disease management services. The Pharmacy Services segment provides integrated suite of pharmacy benefit management, including technology solutions, mail delivery services, specialty pharmacy, network and rebate administration, claims adjudication, and pharmacy discount programs, as well as drug benefits under the federal government’s Medicare Part D program and insurance offerings for individuals and groups.
As of April 28, 2021, the company operated approximately 2,500 retail pharmacy locations in 17 states. Rite Aid Corporation was founded in 1962 and is headquartered in Camp Hill, Pennsylvania.
I looked through a lot of charts over the weekend. I zeroed in on RAD because it looks ready to head higher. It is a widely traded stock with lots of volume.
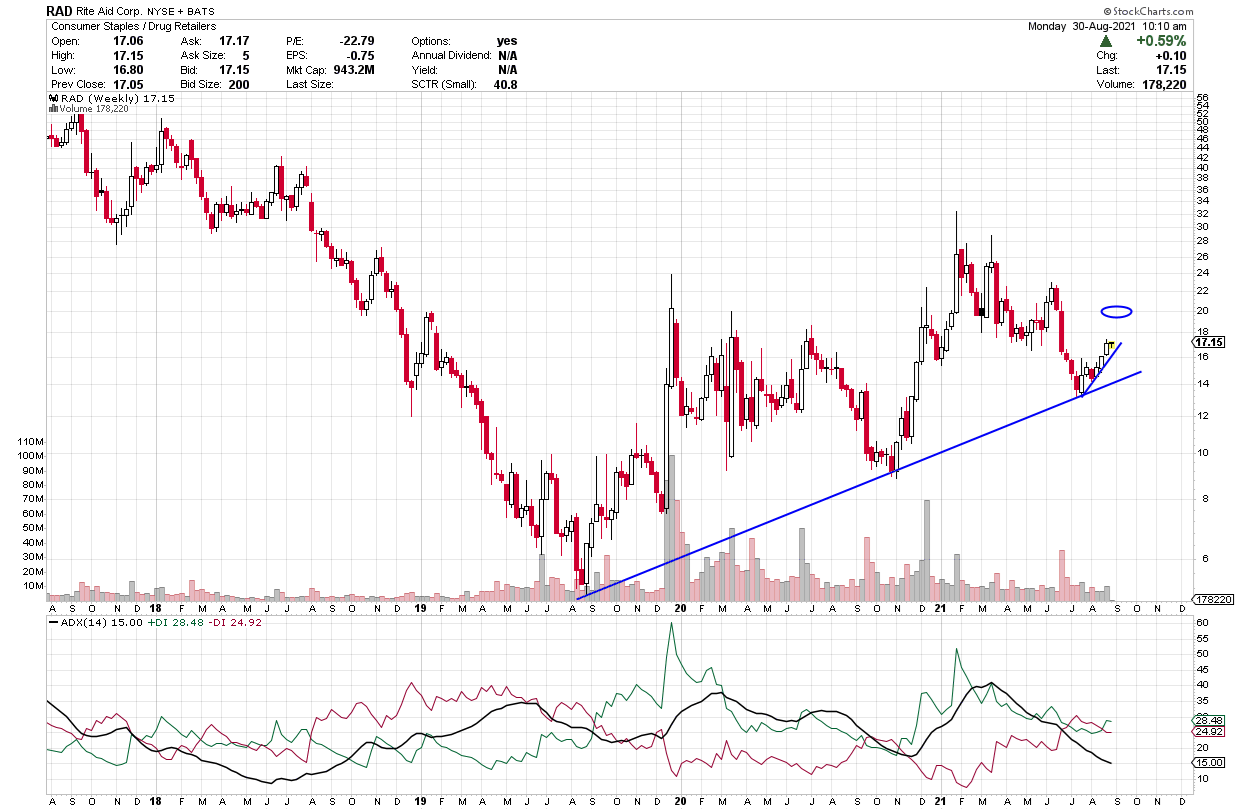

On the ADX indicator below the chart, notice how the green +DI line is on top. The red -DI line is heading down. These are all signals of bullish strength with the thought that price may continue to rise. Also, notice the black ADX line is turning up, rising and this is a sign of strength.
For those who want more info on ADX, I give more details in the section below, or scroll down to the trade info.
Average Directional Index (ADX) Points to Direction and Strength
ADX is an easy indicator to interpret. The +DI line (green) is bullish and when it is on top, it suggests price is going to head up. When the -DI line (red) is on top, it suggests price is going to drop.
The black line is the strength line and when it heads up, it is telling you strength is moving into the DI line that is on top and in control. When the ADX line has been heading down, the DI line on top has been weakening and is ready for a change.
When the DI lines swap places and cross up and the ADX heads up, it suggests strength is moving into the new DI direction.
ADX signal = Profit Payout
Each candle on the chart represents price movement of a week. As the + DI heads up and moves above the black line and both remain above the red line, it suggests there is bullish strength that could continue to grow, especially once the black line starts to turn up. If price continues to move up, the ADX line (black) will continue to turn to head up to imply that strength will continue to support the trade. As long as the ADX is heading up, it means it is supporting the bullish- up direction. The opposite is true if the -DI line heads up to cross the green +DI line – this suggests bearish strength and a drop in price. If the ADX line heads up while the red -DI is on top, is it saying strength is building into the downward direction.
I am looking at its chart and possible trade on Monday, but the pattern looks as if it will continue and the ADX will continue to rise. You don’t want to consider entry if the current candle doesn’t move above 17.50 or if the -DI line were to cross up.
If you are interested in learning more about the ADX strength line, I’d like to suggest you consider getting Inevitable Trend Moves. This book covers in detail how to trade the ADX to jump in during a confirmed strength stage that is as clear as looking at a picture with arrows pointing out direction.
RAD Potential Trade
Please note and remember that I am typing this on Monday, two days before you receive it and the information, I am sharing could change over those two days and is intended to share the opportunities that options offer us.
Rite Aid (RAD) last week was the 3rd bullish week up and this week it continues that upward move. It appears to be ready to head higher and have the ADX flatten out, and then turn up to rise, if this continues, the pattern should remain intact as price keeps rising. Notice the + DI is heading up and is still above the -DI line on the chart above. We want the +DI to cross rising above the -DI (green line above red) to consider a trade.
Price is likely to rise further and move above 17.50 entry. Its first target is 20 as the +DI (green line) moves up and the ADX (black line) eventually turns up. Its current uptrend should remain intact, and price should continue to rise, perhaps even as high as 20.50. We will keep an eye on RAD over the next couple weeks.
I am looking at charts on Monday, so prices are apt to change a little by Wednesday. Be sure the green +DI line above the remains above the red -DI line and price above 17.50 before entry.
The short-term price target for RAD is $20, then, 20.50 perhaps, $22.50, and higher.
To buy shares of RAD today, price would be approximately 17.50. If it rises to $20.50 that would be a gain of $3.00 or 15% profit in a short period of time. If you bought 20 shares the total cost would be $350, and you would gain $60 total on the 20 shares.
This said, option trading offers the potential of a smaller initial investment and higher percentage gain even when price is expected to rise. Let’s take a look.
If you bought one Call option contract covering 100 shares of RADs stock with an Sept 17th expiration date (Sept 21) for the $20.50 strike and premium would be approximately $.17 today or a total of $17 per contract. If price increased the expected $3 to $20.50 target over the next few weeks, the premium might increase approximately $2 to $2.17 per share or $200 on your 100-share contract. This is a gain of $200 on your $17 investment or a 1176% gain over a few weeks.
Remember you can close an option trade anywhere along the line before expiration to take gains or stop a loss.
The example above is a comparison of an investment of $350 and a $60 gain versus a $17 investment and $200 profit. Big difference.
Options can offer a win, win, win trade opportunity. They often offer a smaller overall investment, covering more shares of stock and potentially offer greater profits.
If you are having any kind of trouble taking advantage of these trades, I don’t want you to miss out. I have put together programs that help traders just like you access the potential profits that options provide. I write like we are having a conversation, so the information is easy to understand and apply. Be sure to check out the programs shared in this email and we will make it easy for you to get your share.
I love to trade, and I love to teach. It is my thing.
Yours for a Prosperous Future,
Wendy Kirkland
PS-I have created this daily letter to help you see the great potential you can realize by trading options. Being able to recognize these set ups are a key first step in generating wealth with options. Once you are in a trade, there is a huge range of tools that can be used to manage the many possibilities that can present themselves. If you are interested in learning how to apply these tools and increase the potential of each trade, click here to learn more.

Review of Past Candidates:
Three weeks ago, we discussed WMT and a Sept 3rd expiration (Sept Wk 1) and a 150 strike with a premium of 1.72. Last week despite the market drop, WMT rose and premium went as high as 4.00 and closed last Weds. at 3.30. Nice profit of more than double. Last week, it dropped and is heading up again this week, but it running out of time. Read the article here.
Two weeks ago, we looked at a Put trade on AXP with a Sept 10th expiration 150 strike and a premium of .80. It dropped to a low of 157.33 and a premium of and a rise in premium to 1.19 or a gain of .39 or 48% profit. It rose further last week and is dropping again this week, but isn’t as low as the week of entry. Read the article here.
Last week, we checked out CRM and a Sept 17th (Sept 21) expiration, 270 strike with a premium of 6.60. Price went as high as 275.22. Premium went as high as 9.50 on Thursday and then started to pullback. A 44% gain in one day. Not bad. As I type, it has pulled back to 3.15. Read the article here.


Recent Comments