
From Price Headley, BigTrends.com

Stocks logged a second weekly gain in a row, extending an uptrend that’s been well underway since March. All told, the S&P 500 new sits 18% above that low, reaching another 52-week high last week.
It was hardly the kind of power bulls want to see here, however. The market wasn’t able to hold on to its intraweek high, and once again the volume behind the advance is/was weak. As the old adage describes it, we’re running on fumes.
But we’re still running.
We’ll look at the fading effort in some detail in a moment. Let’s first run through last week’s biggest economic announcements and preview what’s in the lineup for this week. The biggie among this week’s news will be the Fed’s decision on interest rates.
Economic Data Analysis
What a week!
The party started in earnest on Tuesday, with a look at last month’s industrial activity. And, it
wasn’t great. Output fell, as did usage of the nation’s production capacity. This weakness extends and even accelerates what’s been a slow deterioration since the middle of last year. This is a concern.
Capacity Utilization and Industrial Productivity Chart
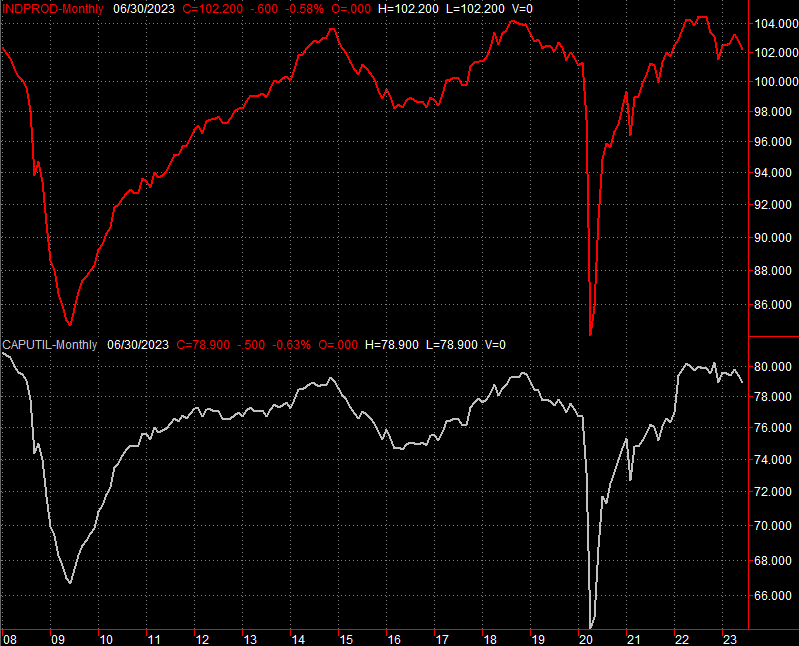
Source: Federal Reserve, TradeStation

We also heard last month’s retail sales numbers on Tuesday. Spending was up, but it’s difficult to tell if this shallowing increase is the result of inflation, or if consumers are still feeling comfortable upping their outlays.
Retail Sales Charts

Source: Census Bureau, TradeStation
On Wednesday we started what will turn into a string of real estate data, with June’s housing starts and building permits report. They both fell as well, perhaps rekindling the lull that actually got going all the way back in early 2022. Given higher interest rates and persistently high prices, this weakness is likely to persist.
Housing Starts and Building Permits Charts

Source: Census Bureau, TradeStation
Meanwhile, although sales of new homes were skyrocketing through May, in June, sales of existing homes continued to dwindle.
New, Existing Home Sales Charts
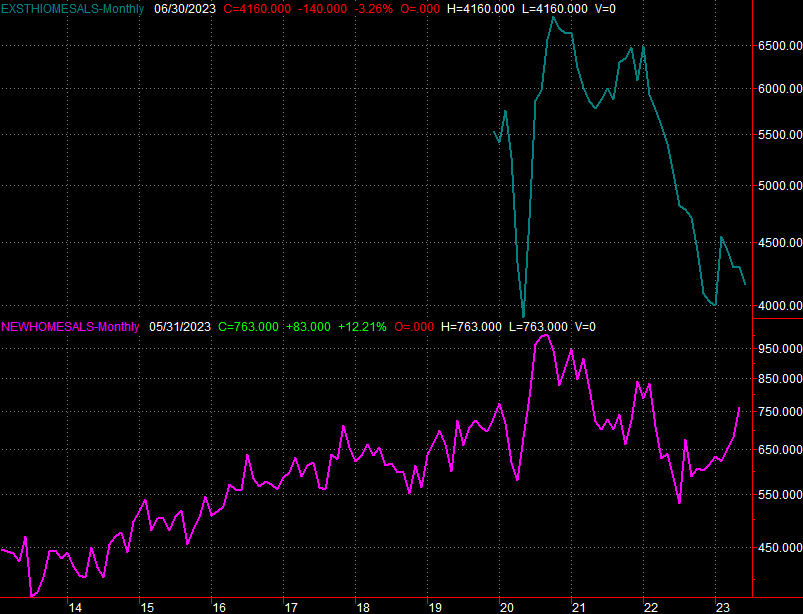
Source: Census Bureau, National Association of Realtors TradeStation

A lack of inventory is the named culprit. And, perhaps that is the problem. That would certainly explain why sales of new homes has been so strong of late. That being said, note that June’s new home sales data will be posted on Wednesday. Economists believe the red-hot pace will start to cool here as well.
Everything else is on the grid.
Economic Calendar

Source: Briefing.com
This week will be about as busy as last week – particularly for real estate hounds. As was noted, June’s new-home sales figure will be released on Wednesday, but key pricing data will be released the day before… albeit for May. Economists believe the Case-Shiller Index continued to dwindle year over year but still up from recent levels, and at the same time, the FHFA Home Price Index likely remained in its modest advance.
Home Price Charts
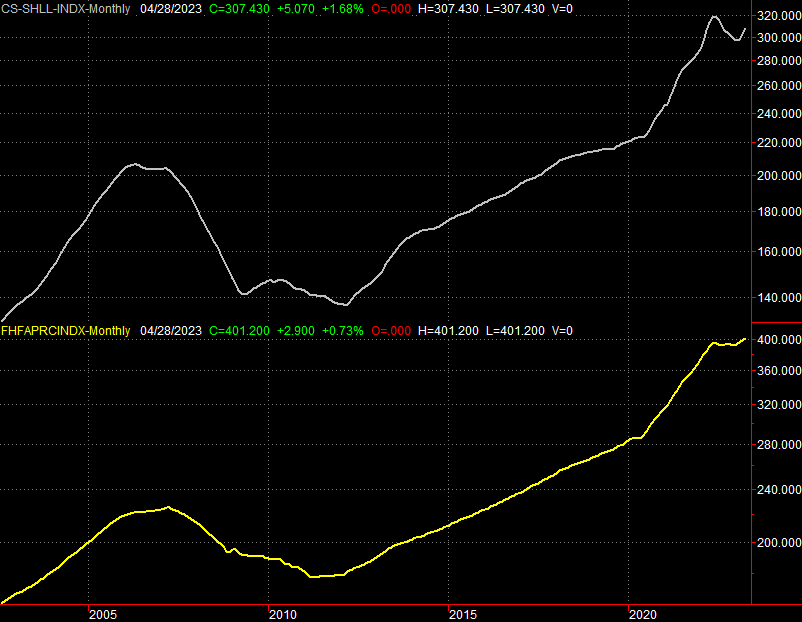
Source: Standard & Poor’s, FHFA, TradeStation
It’s also an important week for sentiment. The Conference Board’s consumer confidence score for July will be released on Tuesday, followed by the University of Michigan’s sentiment measure (3rd estimate) on Friday. Forecasters believe optimism is up a bit from June’s level. Both are in shallow uptrends.
Consumer Sentiment Charts

Source: Conference Board, University of Michigan, TradeStation

Perhaps the most important data due this week, however, will be Wednesday’s interest rare decision from the FOMC, and Thursday’s first guess as to Q2’s GDP growth rate. Forecasters expect the Fed to go ahead with at least one of its suggested two quarter-point rate hikes in the cards for the remainder of the year. Meanwhile, economists believe economic growth is slowing down to a rate of only 1.8%. Both reports have the potential to move the market.
Stock Market Index Analysis
This week’s first chart is the weekly chart of the NASDAQ Composite. It looks troubling. The shape is a gravestone doji, with a close near the very low of its full-week high/low range. That’s bearish, in that it usually indicates the beginning of a reversal from an uptrend into a downtrend. And, the sheer scope of the recent uptrend invites a wave of profit-taking now.
Except, we’re showing you this chart to tell you not to sweat it too much. Friday’s session was the day the NASDAQ 100 was rebalanced so the seven biggest NASDAQ-listed stocks didn’t have as much of a price impact on the NASDAQ 100 itself. This translated into a lot of net selling.
In other words, the overall uptrend that’s been underway since March isn’t even as nearly threatened by last week’s lull than it might seem to be on the surface.
NASDAQ Composite Weekly Chart, with VXN
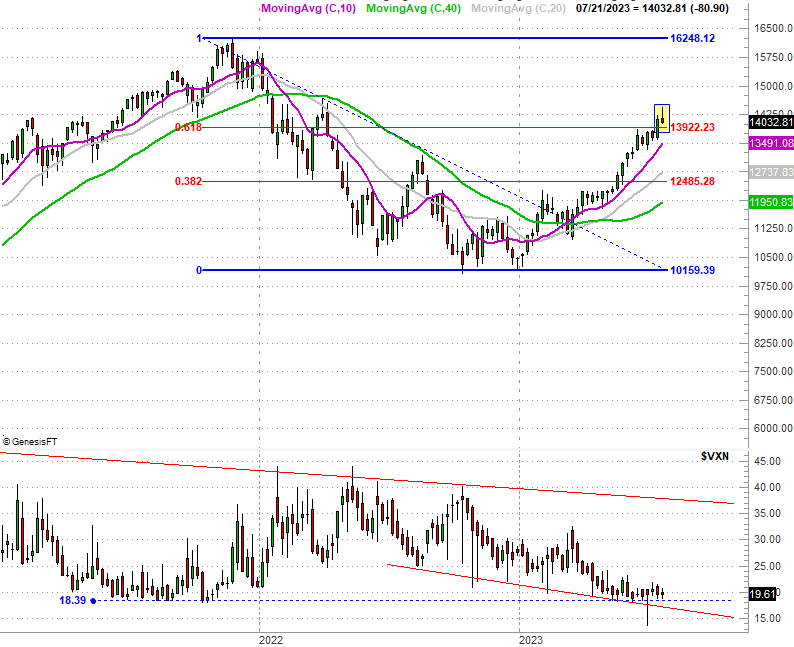
Source: TradeNavigator
It’s also possible this rebalance impacted the NASDAQ’s volatility index (VXN), although it didn’t seem to move much in either direction. All the same, the VXN continues to be finding a horizontal floor near 18.4. This loosely hints that traders are “maxed out” on confidence and optimism… a condition often seen when stocks are ready to dish out an unpleasant surprise.
Here’s why we’re not too worried about it, however, and presuming the weakness late last week really is the result of the rebalance. The Dow Jones Industrial Average not only didn’t seem adversely impacted by the rebalance, it appeared to rally in defiance of it.
Dow Jones Industrial Average Weekly Chart
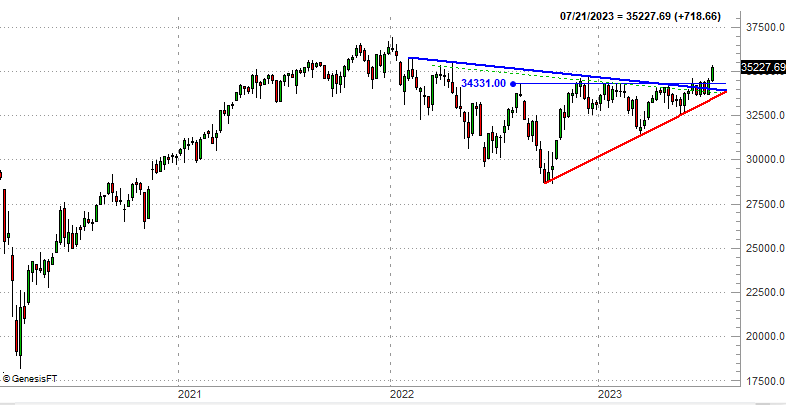
Source: TradeNavigator
You could make the argument that the NASDAQ’s loss and the Dow’s gain are both the result of the rebalance, as the “balancing” part of the effort meant index funds were offsetting the sale of the so-called “magnificent seven” by buying a bunch of the blue chips the Dow holds. That math doesn’t quite hold enough proverbial water, however, to explain the depth of these moves. The Dow Jones Industrial Average’s big gain last week was largely rooted in bag gains from Johnson & Johnson (JNJ), Chevron (CVX), and Walgreens Boots (WBA), which weren’t involved in the NASDAQ’s reshuffling at all.
As for the S&P 500, it’s somewhere in between. It gave up most of its intraweek gain, but still ended the week higher than where it started it. Notably, the guidelines defining its rally from its March low are still intact. So is the rally.
S&P 500 Weekly Chart, with VIX
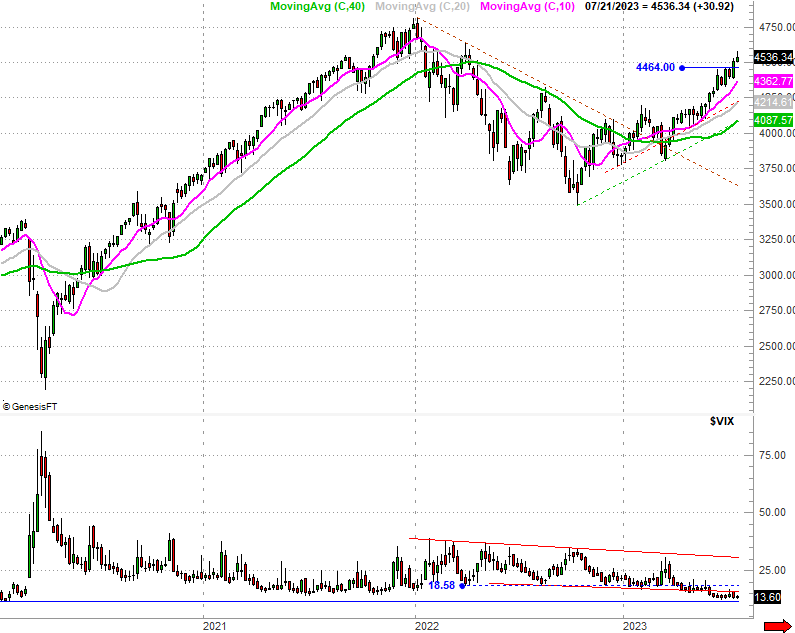
Source: TradeNavigator
The only noteworthy concern with the S&P 500 here is the same as the NASDAQ’s… the S&P 500’s volatility index (VIX) is “too low.” This suggests the market is ripe for a pullback. It just doesn’t indicate when that might start to happen. The VIX can linger at low levels for a long, long time while stocks continue to rally.
In any case, here’s the daily chart of the S&P 500 so we can take a fine-tuned look at where the broad market it, and what may be next. Even with last week’s late lull the index remains well above any and all of its most likely technical floors. While there’s still room and reason to brace for a (much-needed) dip to relieve some of this overbought pressure, there’s also a myriad of ways for such a dip to be stopped early on.
S&P 500 Daily Chart, with VIX
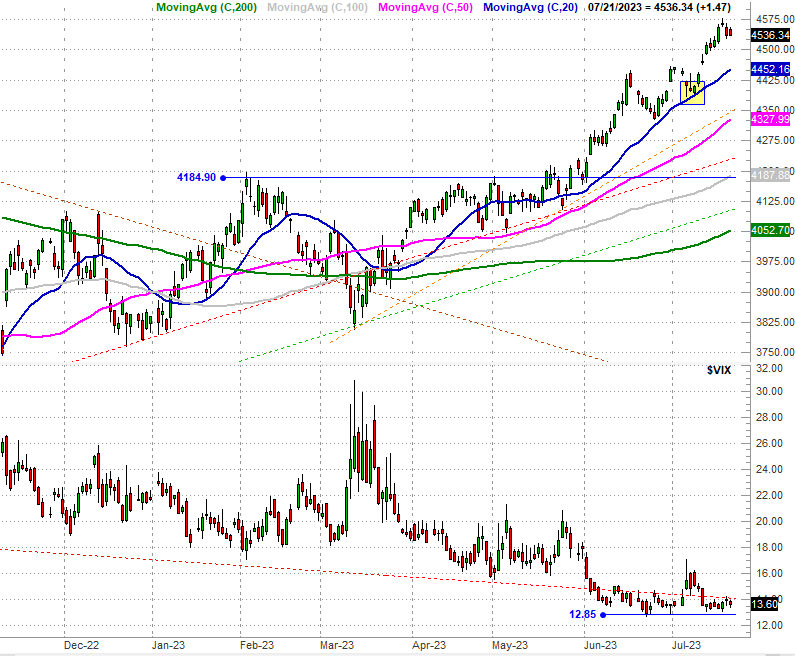
Bottom line? The broad trend is still bullish, although it wouldn’t be crazy to prepare for a healthy pullback. Just know that such a shakeup may actually benefit the Dow (even more than it’s already benefiting) as traders seek out its more discernible safety. The tech-heavy NASDAQ is the most vulnerable to profit-taking here.
Price Headley
BigTrends.com


Recent Comments