
Friday, September 24th, 2021
Happy Fabulous Friday!
I teach everyday people (like me) to trade options. I do my best to write in an understandable way as if we are talking over the kitchen table.
The Dow corrected in huge drop on Monday and is now up two days as I type on Wednesday. There is Fed meeting this afternoon and overall, the markets still feel fragile from Monday’s pullback.
For today’s Trade of the Day, we will be studying American Express Company (AXP).
American Express Company, together with its subsidiaries, provides charge and credit payment card products, and travel-related services worldwide. The company operates through three segments: Global Consumer Services Group, Global Commercial Services, and Global Merchant and Network Services. Its products and services include payment and financing products; network services; accounts payable expense management products and services; and travel and lifestyle services.
American Express Company was founded in 1850 and is headquartered in New York, New York.
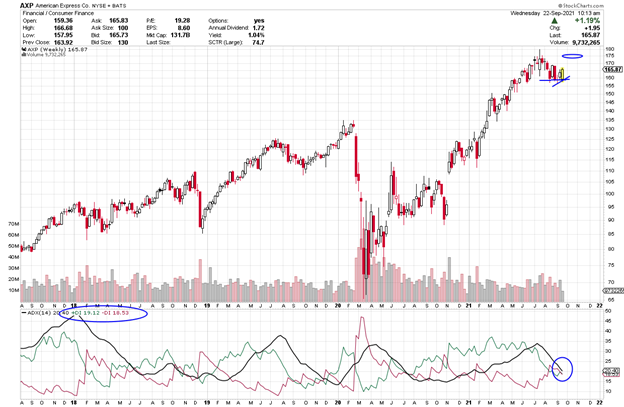
Let’s take a look at AXP’s weekly chart.
The ADX +DI (green line) is above the -DI and if it keeps heading up, the ADX line will eventually start to turn up. As long as the +DI is above the -DI, price should rise. Green above red is an indication of strength. When the +DI is bullish and the ADX turns up, it shows strength. If you want to learn more about ADX, read on or, if not, scroll down to the alert.
Average Direction Index (ADX) – Strength Indicator
The Average Directional Index consists of 3 lines: Green, Red and Black.
Green = +DI (Bullish)
Red = -DI (Bearish)
Black = ADX Strength Line
The DI line that is on top is in control. If the ADX line is heading up, strength is supporting the DI line that is on top and in control.
Check Out the Trade Alert Signal
Each candle on the chart represents price movement over a 5-day (week) period; therefore, it takes weeks for trades to play out. On the chart, the week is a bullish candle as I type. When the +DI crosses over the -DI line, it gives a buy signal (as the +DI line (green) appears as if it is in control and rising to head up on the ADX indicator, and as the ADX turns up that is even more bullish, suggesting an upward move is gaining strength. I’d like to see the green line to continue its upward bias and then the black line to turn and head up as well. All are bullish signs of strength. When the +DI crosses the ADX (black line) and when it rises, it shows a new burst of strength coming into the equity.
The Black ADX line is a strength line and if it flips up and continues to head up, it shows strength, and we’ll know strength will continue to flow into this equity. We will keep an eye on AXP over the course of the next few weeks.
If AXP’s price moves above or stays above $167, you could consider a trade. The short-term price target for AXP is $175 and then, perhaps, higher. With the swings and recent volatility I am suggesting small profit targets until a market trend starts again.
AXP Potential Trade – Showing Strength
This signal could give a quick payout if it continues its upward move, and the strength of this pattern continues. It looks as if it could push above $175.
To buy shares of AXP would cost approximately $167 per share and if it reaches its near-term target of $175 that would be a gain of $8 or 4%.
This is a great example of the benefits of trading options. Let’s discuss this as a study case.
Option trading offers the potential of a lower initial investment and higher percentage gain. Let’s take a look and make a comparison.
The plus DI (green line) is just now above the -DI and if it stays above the -DI (red) line and rises above $167 by Friday a call trade can be considered.
If you buy 4 shares at $167, you will invest $668. If the stock increases in price to $175, you will earn a profit of $8 per share or $32 for the 4 shares or about 4%.
If you bought one option contract covering 100 shares of AXP with a Oct 8th (Oct wk2) expiration date for the $175 strike and premium would be approximately $1.31 today or $131 per 100 share contract. If price increased to the expected $175 target or a gain of $8 over the next few weeks, the premium would likely increase $4 to $5.31 ($4 x 100 share contract = $400 Profit.) $400 profit on your $131 investment, this is an 305% gain. Nice! Terrific trade if it hits it target!
Trading options is a win, win, win opportunity. Options often offer a smaller overall investment, covering more shares of stock and potential for greater profits.
I like to stress when trading options, you don’t need to wait for the expiration date to close the trade. You can close anywhere along the way prior to the expiration date. It is never a bad idea to take profit.
Trading options is like renting stocks for a fixed period of time. The potential to generate steady income with options is real and it can be transforming. Watch this video to learn how you can use option trading to achieve financial freedom. click here
Yours for a Prosperous Future,
Wendy Kirkland

Past Equity Candidates:
Last week, we looked at TECK and a Oct 15th (Oct 21) expiration, a 28 strike and a premium of .98. Monday it was hit with the big drop. Price is back up to 25.26 on Wednesday as I type and its premium has inched up to .57 (still a loss), but it appears as if it may recover and it still has time if traders didn’t close as the market plunged on Monday.


Recent Comments